
Synthetic monitoring tools are useful for identifying short-term technical problems that may have an impact on the user experience although the software is still in development. Timely screening allows businesses to avert potential technical problems.
Availability monitoring allows a company to validate that a website or application is up and running and responding to queries. Monitoring availability can also take a more detailed approach, such as checking to ensure that certain content is available or that a specific sort of API call is successful.
Web performance monitoring often examines certain web metrics such as page load speed and the performance of individual web page elements. It examines online content, errors, and slow response times.
Synthetic transaction monitoring tries to finish specified transactions like logging in, filling out a form, and checking out.
API tests entail a company monitoring certain endpoints at each tier of the network and application architecture.
What are the features to consider to select the best Synthetic monitoring tools:
- Automatic execution.
- Run the various types of tests in the desired location, using various types of browsers all over the world.
- AI – assistance is essential to the role.
- Collaboration across teams to expedite teamwork.
- Receive Synthetics Alerts and Integration
#1 Atatus
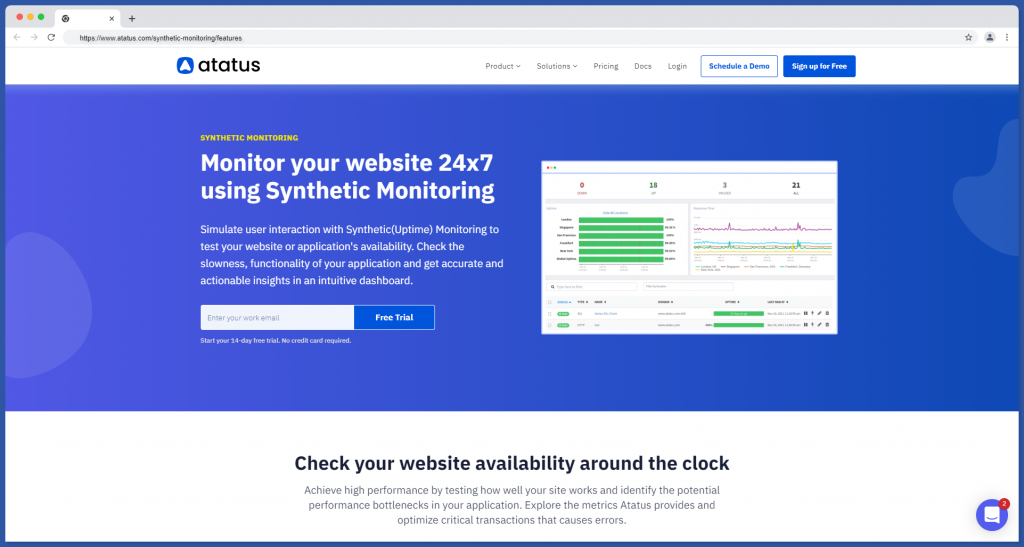
Atatus has the best synthetic monitoring tool because it allows you to simulate user interaction to test the availability of your website or application.
In Atatus’s intuitive dashboard, you can check the slowness and functionality of your application as well as get accurate and actionable insights.
Furthermore, Atatus, as the best synthetic monitoring tool, provides full-stack monitoring with actionable, real-time metrics to diagnose and resolve backend application performance bottlenecks.
Also, identify performance bottlenecks and begin refining your app to provide the best digital experience to your customers by using unified monitoring.
Features:
- API tests with multiple steps
- Keep track of the errors and fix them to ensure that your website is accessible to your customers 24 hours a day, seven days a week.
- Run the various types of tests in the desired location, using various types of browsers all over the world.
- Receive Synthetics Alerts and Integration
- Simple configuration and customization simulate traffic within a specific area, allowing you to easily ensure performance, functionality, and availability.
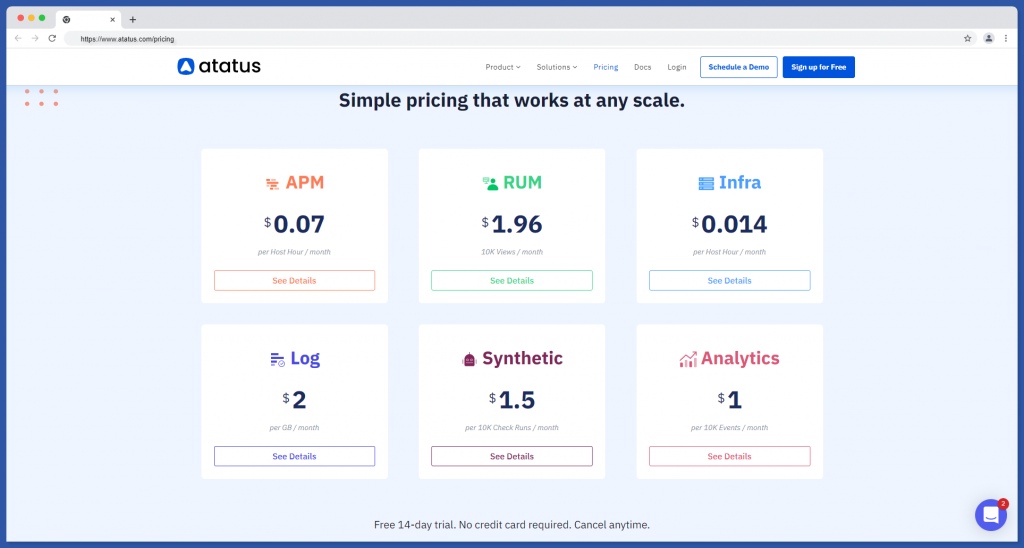
Pricings:
- Free trials for 14 days.
- $1.5 for every 10K check run/month.
#2 New Relic
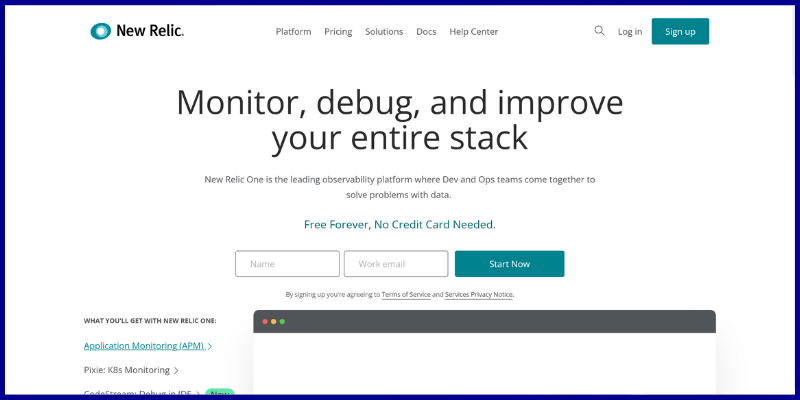
New Relic is best known for its APM tool, but they also offer a RUM solution, New Relic Browser, to round out their monitoring toolset.
The New Relic Browser includes improved RUM tools that provide insights from the perspective of users by focusing on browser performance. It tracks a page’s or view’s entire life cycle, from the moment users launch the app until they exit.
Features:
- To begin, optimize the overall performance of the application by combining key metrics.
- It detects anomalies and deficiencies using popular open-source tools and eight programming languages.
- Also enables widespread instrumentation.
- Thirdly, it quickly identifies and resolves issues.
- Finally, contrast the changes, dependencies, and configurations.
Pricings:
- It has a free version.
- The standard version costs $0.25/GB.
- The Pro version and Enterprise version prices are customizable.
Learn More:
#3 Uptrends
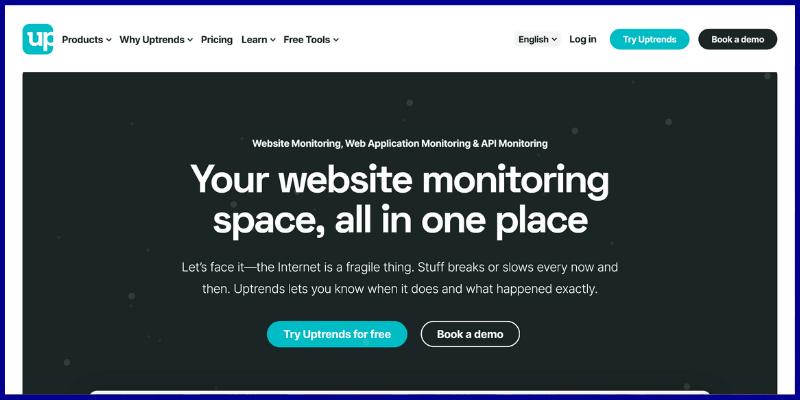
Uptrends launch a real browser (Chrome, Firefox, or Internet Explorer) in one of the global locations you specify and loads your website with all of its elements. Moreover, users will get a detailed picture of your website’s performance, and you’ll notice spikes in load times right away.
Simultaneous, synthetic monitoring tools allow you to create data more quickly. Choose three or more locations, and Uptrends will run tests from all of them at the same time. You’ll get a lot more data and alerts much faster.
Features:
- You will be notified if your website’s speed deteriorates.
- Also, mobile website monitoring emulates a mobile device by using a Chrome or Firefox browser.
- You can customize the screen size and resolution.
- They also generate screenshots (similar to a filmstrip) while the page is loading.
- Group the elements of your page into categories such as statistics, CDN, social, and ads, or make your own.
Pricings:
- All the packs have free trials for 30 days.
- The starter plan costs $16.21/month.
- The business plan starts at $22.61/month.
- The enterprise plan starts at $54.04/month.
#4 Dynatrace
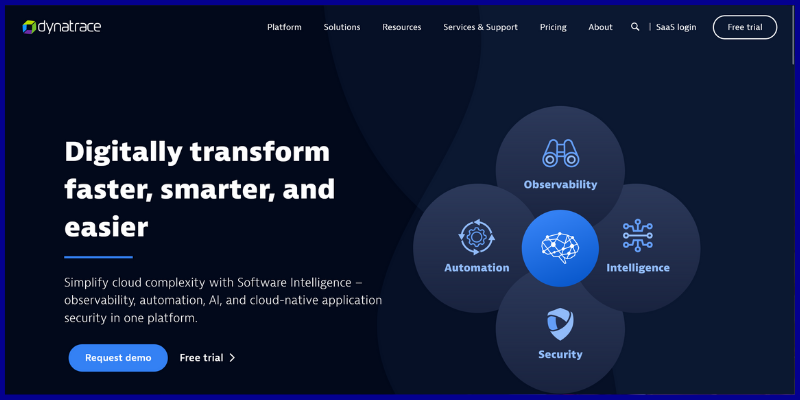
The Dynatrace Digital Experience Monitoring service offers a customizable combination of synthetic modeling and real-time user monitoring, as well as the ability to rewind sessions. The customer buys credits and then selects which service to use them on.
The Real User Monitoring features of Dynatrace provide a run-through trace of each user’s actions on a site, as well as a complex array that reveals the performance of each site feature. Dynatrace has a one-of-a-kind session recording feature.
Furthermore, it allows a technician to replay a session after it has been completed, viewing the screen as if it were a Windows remote view.
Features:
- AI – assistance is essential to the role.
- Collaboration across teams to expedite teamwork.
- Also, has automatic execution.
- Finally, remove blind spots, respond quickly to problems, and provide an exceptional customer experience.
Pricing:
- $69 for Full-stack monitoring.
- $21 for Infrastructure monitoring.
- $11 for Digital experience monitoring.
- $12 for Application Security.
- $25 for Open ingestion.
- $0.10 for Cloud automation.
#5 Checkly
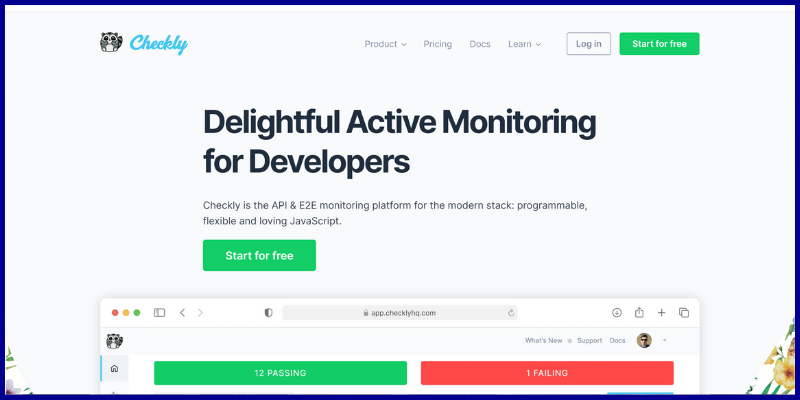
Checkly is one of the synthetic monitoring tools. Getting a monitoring script going is a lot easier than you might think.
Also, it uses the Puppeteer & Playwright frameworks to accurately simulate interactions with a Chrome browser.
Features:
- Automatically collect error traces, screenshots, and performance metrics.
- Easily identify JavaScript errors and missing resources
- Also, added performance metrics such as Google’s Core Web Vitals
- Finally, helps to achieve a 100% match with real-world conditions
Pricings:
- It has a free plan for 50k API check runs per month.
- Enterprise starts at $1500 per month.
#6 Pingdom
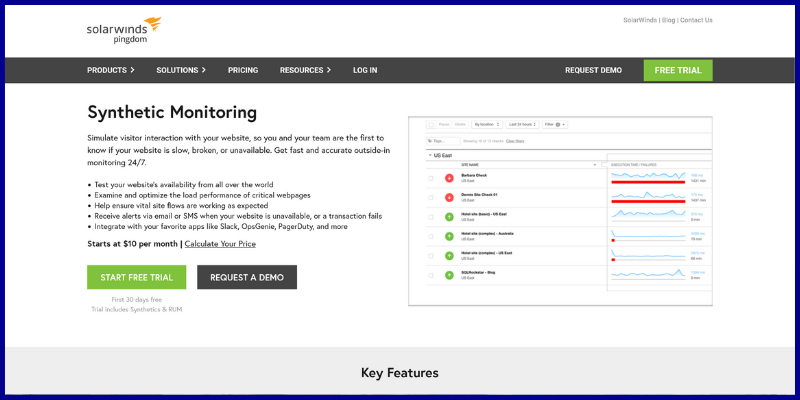
Pingdom literally puts on user interaction with your website so that you and your team are the first to notice if it’s slow, broken, or unavailable.
The needs of the average firm are quite clear and uncomplicated. Moreover, there is only one application and a few endpoints to monitor, and there are only a few essential client experiences.
Furthermore, in Pingdom, establishing a synthetic monitoring tools test is too simple.
Features:
- Investigate and improve the load efficiency of production webpages.
- Furthermore, check the availability of your website from all around the world.
- Slack, OpsGenie, PagerDuty, and more popular apps can be integrated.
- Also, assist in ensuring that critical site flows operate as planned.
- Start receiving email or SMS notifications when your website is inaccessible or a transaction fails.
Pricings:
- Free trial for 30 days.
- $10 per month for both the Synthetic Monitoring tool plan as well as Real User Monitoring plan.
- Customized bill for Enterprise plan.
#7 AlertBot

AlertBot is one of the elite synthetic monitoring tools because provides advanced features that are simple to use, such as sending helpful health reports directly to your inbox and alerting you if your site encounters any problems.
A web recorder can replicate the experience of a real user. Also, simply press the record button, interact with your pages, save it, and the monitoring will begin.
Features:
- Also, notify your team of website errors, slowness, and unresponsive behavior.
- AlertBot includes a large number of locations as part of every plan.
- Furthermore, importantly has no additional cost.
- Identify issues really quickly.
Pricing:
- Plans starting at $99.95
#8 Sematext
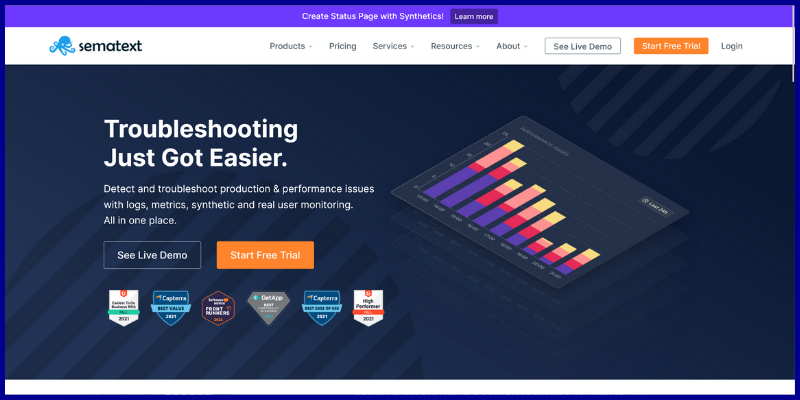
Sematext is another synthetic monitoring tools that is represented by two happy (or sad) face symbols that indicate how quickly a site loads pages and responds to Ajax (Asynchronous Javascript, JSON, and XML) queries.
Because of these data modification features, the same dashboard interface can be used for real-time data monitoring as well as historical data analysis. Users can also view log and event data as lists of records or study those data sources through graphs.
Features:
- Keep an eye on the Apdex Score to identify performance bottlenecks.
- Also, has real-time automatic alerts for all customers.
- Recreate a real-world user journey.
- Finally, has insights into web vitals that are intuitive.
Pricings:
- The monitoring plan starts at $0.007 per hour.
- The experience plan starts at $9 per month.
- The synthetic plan starts at $2 per month.
- Logs plan starts at $50 per month.
Conclusion:
My choice and recommendation will be Atatus and New Relic Browser to have the best full use of the website, affordably and to use its features as a whole.
Take time to select the best one, I hope my blog helps you to get an idea quickly by looking at each of the best synthetic monitoring tools and their features. I found this Best Synthetic monitoring tool out of my own curiosity and hope you will also find them useful in your website monitoring experience and find my ratings right according to their features and limitations. Share this blog with your learner friend and follow our PublishSquare for more blogs like this.