
Real User Monitoring is a type of passive online monitoring. We call it “passive” because it is based on services that continuously monitor the system in the background, measuring availability, functioning, and responsiveness.
Synthetic Monitoring, on the other hand, is active online monitoring. Behavioral scripts are deployed in a browser to replicate an end-trip user’s through a website in synthetic monitoring.
Furthermore, ongoing monitoring allows webmasters to test the application before launching it. As a result, it is a must-have tool for sites with a significant volume of traffic. RUM, unlike synthetic monitoring, never sleeps. It captures data from each user across all requests, using every browser.
What are the features to consider to select the best real user monitoring tool:
- Firstly, automatic performance.
- AI – Bot assistance.
- Better Troubleshooting performance.
- Customizable reports on website performance.
- Finally, identify in-depth insights.
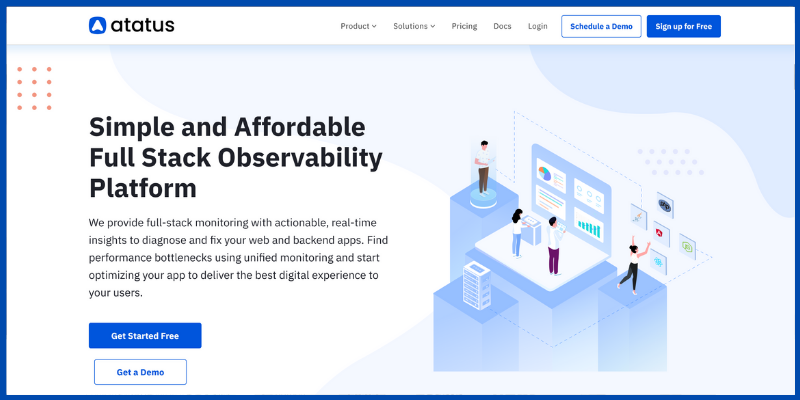
#1 Atatus
Atatus is the best RUM which makes sure that your teams have a deep understanding of all the further key performance indicators required to deliver high-quality, reliable websites.
Moreover, they offer full-stack monitoring with actionable, real-time metrics to diagnose and resolve performance bottlenecks of your backend applications. Also, using unified monitoring, identify performance bottlenecks and begin refining your app to provide the best digital experience to your consumers.
Features:
- Easy to use UI interface.
- Support for all major frontend frameworks (SPA performance metrics).
- Insightful metrics with runtime support.
- Has RUM, APM, Synthetics, Logs and Server.
- Moreover, it has dedicated support
- Easy to install without changing your code.
Pricings:
- It has a 14 days of free trial without any credit card.
- RUM is only $1.96 per 10K views /month.
#2 Dynatrace Digital Experience Monitoring
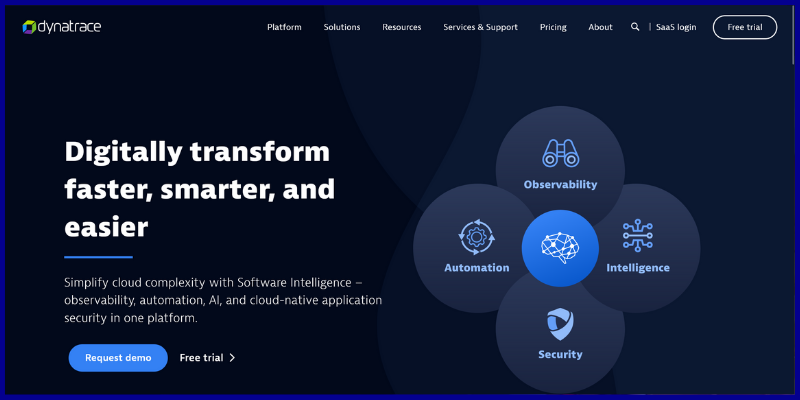
The Dynatrace Digital Experience Monitoring service provides a customizable combination of synthetic modeling and real-time user monitoring, as well as a session rewind capability. The customer purchases credits and then chooses which service to utilize them on.
Dynatrace’s Real User Monitoring features provide a run-through trace of each user’s actions on a site as well as a complex array that reveals the performance of each site feature.
Furthermore, the Dynatrace service has a one-of-a-kind session recording feature. It enables a technician to replay a session after it has finished, viewing the screen as if it were a windows remote view of a user’s live actions.
Features:
- AI – assistance is important to the performance.
- Cross-team collaboration to accelerate team work.
- Automatic performance.
- Finally, remove blind spots, fix problems quickly, and provide an exceptional customer experience.
Pricing:
- $69 for Full-stack monitoring.
- $21 for Infrastructure monitoring.
- $11 for Digital experience monitoring.
- $12 for Application Security.
- $25 for Open ingestion.
- $0.10 for Cloud automation.
#3 Pingdom Real User Monitoring
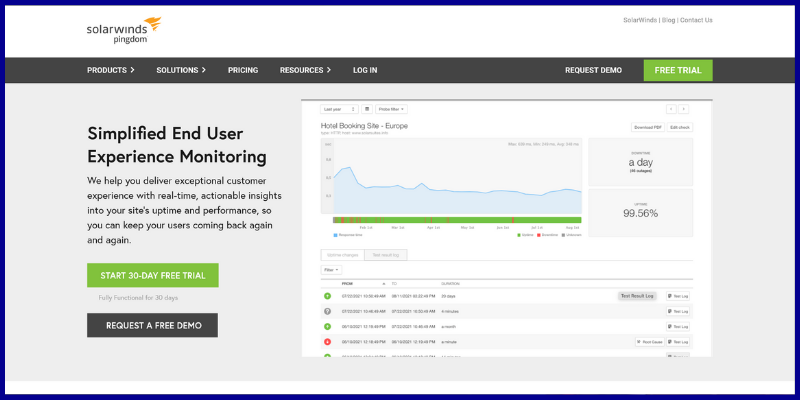
Performance data is saved on the Pingdom server and can be analyzed over time. This is important for detecting quality issues caused by new pages or functionalities. This is also a great platform for marketing because it allows them to observe which sites receive the most traffic and how those users are situated.
The Pingdom service has a report generation feature that allows for ad hoc performance analysis. These reports are given in the form of a web page once they have been prepared.
Also, you can provide a link to a report that allows the receiver to filter and sort the data. Moreover, if your company hosts the websites of other companies, these reports are essential for tracking SLAs and interacting with customers.
Features:
- Observe your users and their digital behavior with a map view.
- User behavior metrics.
- Can use advanced filtering and identify how customers access your website.
- Troubleshooting performance issues from the end-users perspective.
- Customizable reports on website performance.
- Easy sharing.
Pricing:
- Free trial for 30 days.
- $10 per month for both Synthetic Monitoring plan as well as Real User Monitoring plan.
- Customized bill for Enterprise plan.
#4 New Relic Browser
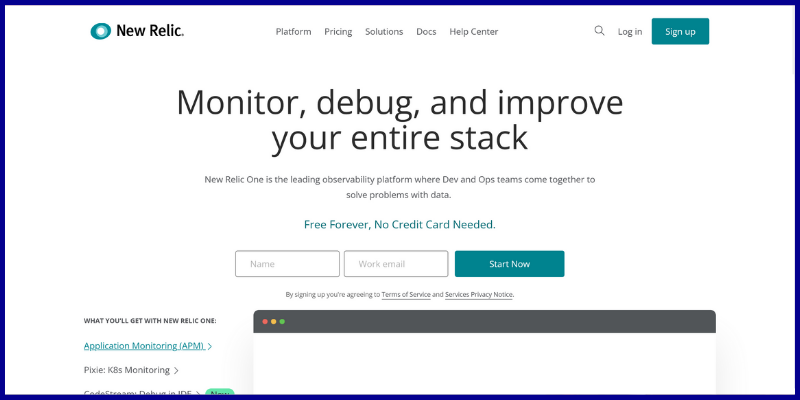
New Relic is well known for its APM tool, but they also provide a RUM solution, New Relic Browser, to round out their monitoring toolset.
New Relic Browser includes enhanced RUM tools that provide you with insights from the perspective of users by focusing on browser performance. It tracks the whole life cycle of a page or view, from the moment users launch the app until they exit.
Features:
- Firstly, Optimize the performance on the whole application by combining key metrics.
- Detects anomalies, deficiencies
- works with eight programming languages with popular open-source tools.
- Secondly, enabling instrumentation ubiquity.
- Thirdly, it finds root causes and fix issues rapidly.
- .Finally compare changes, dependencies & configurations.
Pricings:
- Has a free version.
- The standard version costs $0.25/GB.
- Pro version and Enterprise version prices are customizable.
#5 Datadog Real User Monitoring
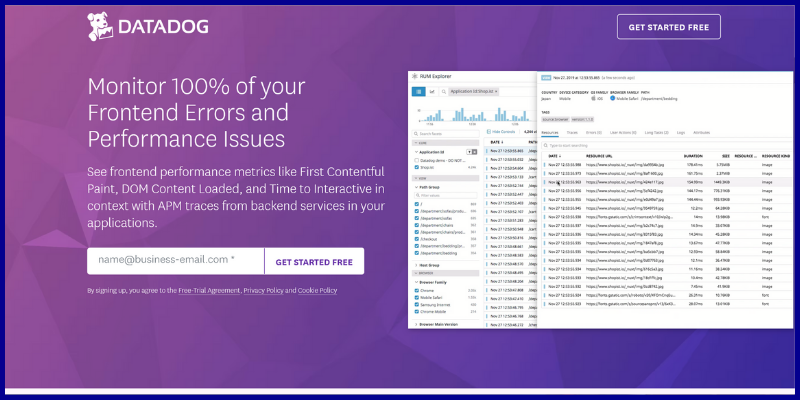
Datadog’s Real User Monitoring service contains performance expectation thresholds and notifications when those levels go below certain thresholds. As a result, website managers will only need to access the dashboard when they are warned of potential issues.
Even while the dashboard’s crowded data panes can be overwhelming, their congestion of information eliminates the need to switch between screens to receive a complete picture of a website’s performance.
Moreover, deep-dive displays are less congested, and they include tools for debugging common faults and determining the root cause of delivery issues.
Features:
- Troubleshoot frontend performance issues faster.
- Easy optimize performance.
- Identify in-depth insights into product usage and user behavior.
- Also, end-to-end visibility.
- Enhance End-user experience and customer satisfaction.
Pricing:
- Provides 14 days of a free trial.
- $15 per month for the pro plan.
- $23 per month for enterprise plan.
#6 Site24x7 website monitoring
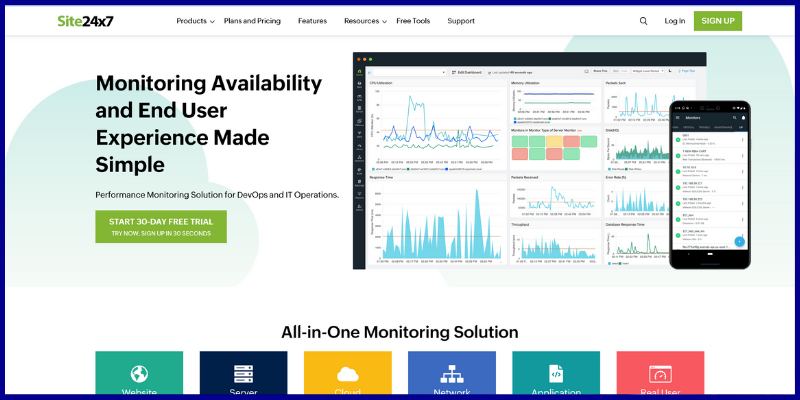
Site24x7 Website Monitoring is cloud-based offers a variety of website testing tools as well as network, server, and application monitoring.
Also, when a customer with information monitoring identifies systemic problems, the combination of services in this bundle allows analysts to trace back via the app stack to the server and network.
Users do not need to sit down and watch the dashboard for faults because Site24x7 contains a performance limit monitor that alerts them if difficulties develop.
Furthermore, this service is powered by an artificial intelligence assessment feature that filters out dissimilar reporting. Technicians can receive alerts via SMS, email, voice call, or instant messaging post.
Features:
- Identify slow-performance transactions.
- Measure the impact of individual resources.
- Point out the Javascript errors.
- Also, analyze user sessions.
Pricings:
- The starter plan costs $9/month.
- PRO plan costs $35/month.
- Classic plan costs $89/month.
- Enterprise plan costs $225/month.
#7 Akamai mPluse
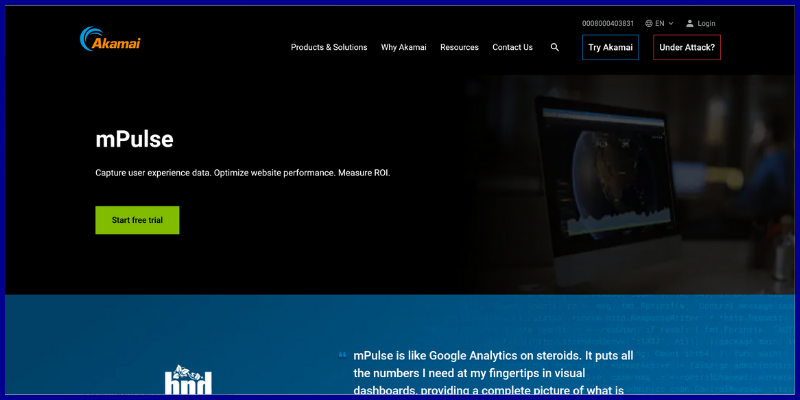
Akamai mPulse (formerly SOASTA) allows you to go further within performance and error analytics to determine their influence on user experience metrics like conversions and page views. Using data directly from the user’s browser, users can explore website performance issues and also optimization opportunities.
Features:
- Real-time insights are stored every 13 months for historical analysis.
- Also, actionable metrics include Google Code Web Vitals.
- Anomaly detection & prevention of potential problems.
- Bot management on business metrics.
- Finally, third-party resources for ads and analytics.
Pricing:
- Pricing details for this product or service have not been supplied by Akamai mPulse.
#8 Sematext Experience
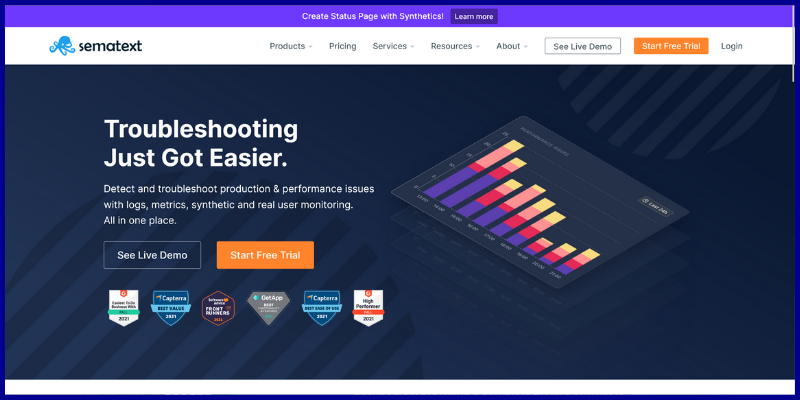
Sematext Experience dashboard, a very quick status recognition feature is implemented. Also, this takes the shape of two cheerful face symbols that represent how quickly a site loads pages and responds to Ajax (Asynchronous Javascript, JSON, and XML) queries.
Because of these data modification features, the same dashboard interface may be utilized for both real-time data monitoring and historical analysis. Users can also choose to see log and event data as lists of records or to study those data sources in graphs.
Features:
- Monitor the Apdex Score and identify performance bottleneck.
- Automatic Alerts in real-time for all the customers.
- Retrace real user journey.
- Finally, intuitive insights into web vitals.
Pricings:
- The monitoring plan starts at $0.007 per hour.
- The experience plan starts at $9 per month.
- The synthetic plan starts at $2 per month.
- Logs plan starts at $50 per month.
#9 AppDynamics End User Monitoring
AppDynamics End User Monitoring records system events during each user session and aggregates them to produce overall system performance metrics. Load times and error rates, for example, are standard user experience metrics that are all recorded.
Also, with those standards, code-level transactions are logged, allowing website designers to observe exactly which stages impede down a website’s display and service delivery.
The AppDynamics technology allows a web developer to monitor which third-party apps are slowing down a site’s performance. It is possible that none of the performance issues on a website are the product of the site itself, but rather of a slow-to-deliver API.
Features:
- Firstly, easy identification of end-user issues at the source.
- Experience journey mapping charts for the evaluation.
- Optimize customer journeys across devices, operating systems and browser types.
- Intelligent cloud agents to assess your business transaction performance and spot problems.
- Finally, streamline collaboration between operations and applications teams.
Pricings:
- Infrastructure monitoring edition plan costs $6/month.
- Premium edition plans cost $60/month.
- Enterprise plan costs $90/month.
Conclusion:
My choice and recommendation will be Atatus and New Relic Browser to have the best full use of the website, affordably and to use its features to its whole.
- Atatus
- Dynatrace Digital Experience Monitoring
- Pingdom Real User Monitoring
- New Relic Browser
- Datadog Real User Monitoring
- Site24x7 website monitoring
- Akamai mPulse
- Sematext Experience
- AppDynamics End User Monitoring
Take time to select the best one, I hope my blog helps you to have an idea quickly looking at each of the Best Real User Monitoring Tools and Services features. I found these Best Real User Monitoring Software out of my own curiosity and hope you will also find them useful in your website monitoring experience and find my ratings right according to their features and limitations. Share this blog with your learner friend and follow our PublishSquare for more blogs like this.